“I made the first one, I said, 'Let me see if I can make two.'
I made the second one, I said, 'Let me see if I can make three.'
I MADE THE THIRD ONE, I SAID, 'I’VE GOT A RHYTHM GOING.'”
-Kobe Bryant, on setting NBA single-game 3-point record
Across the game of basketball, players, coaches, and fans almost unanimously believe in the “hot-hand” phenomena: sometimes a player simply can’t miss. This phenomena is easily understood in the game of basketball, but describes in general a pattern in the human decision making process. We often attribute recent and consistent success at work, school, or some other activity to something beyond chance by saying “That person is on fire.”
Until recently, the “Hot Hand Theory” was touted as the “Hot Hand Fallacy” by prominent cognitive psychologists and statisticians, chalked to an example of humans’ tendency to misunderstand randomness. Specifically, people tend to assume that the Law of Large Numbers applies to local trials, or a fallacious “Law of Small Numbers.”
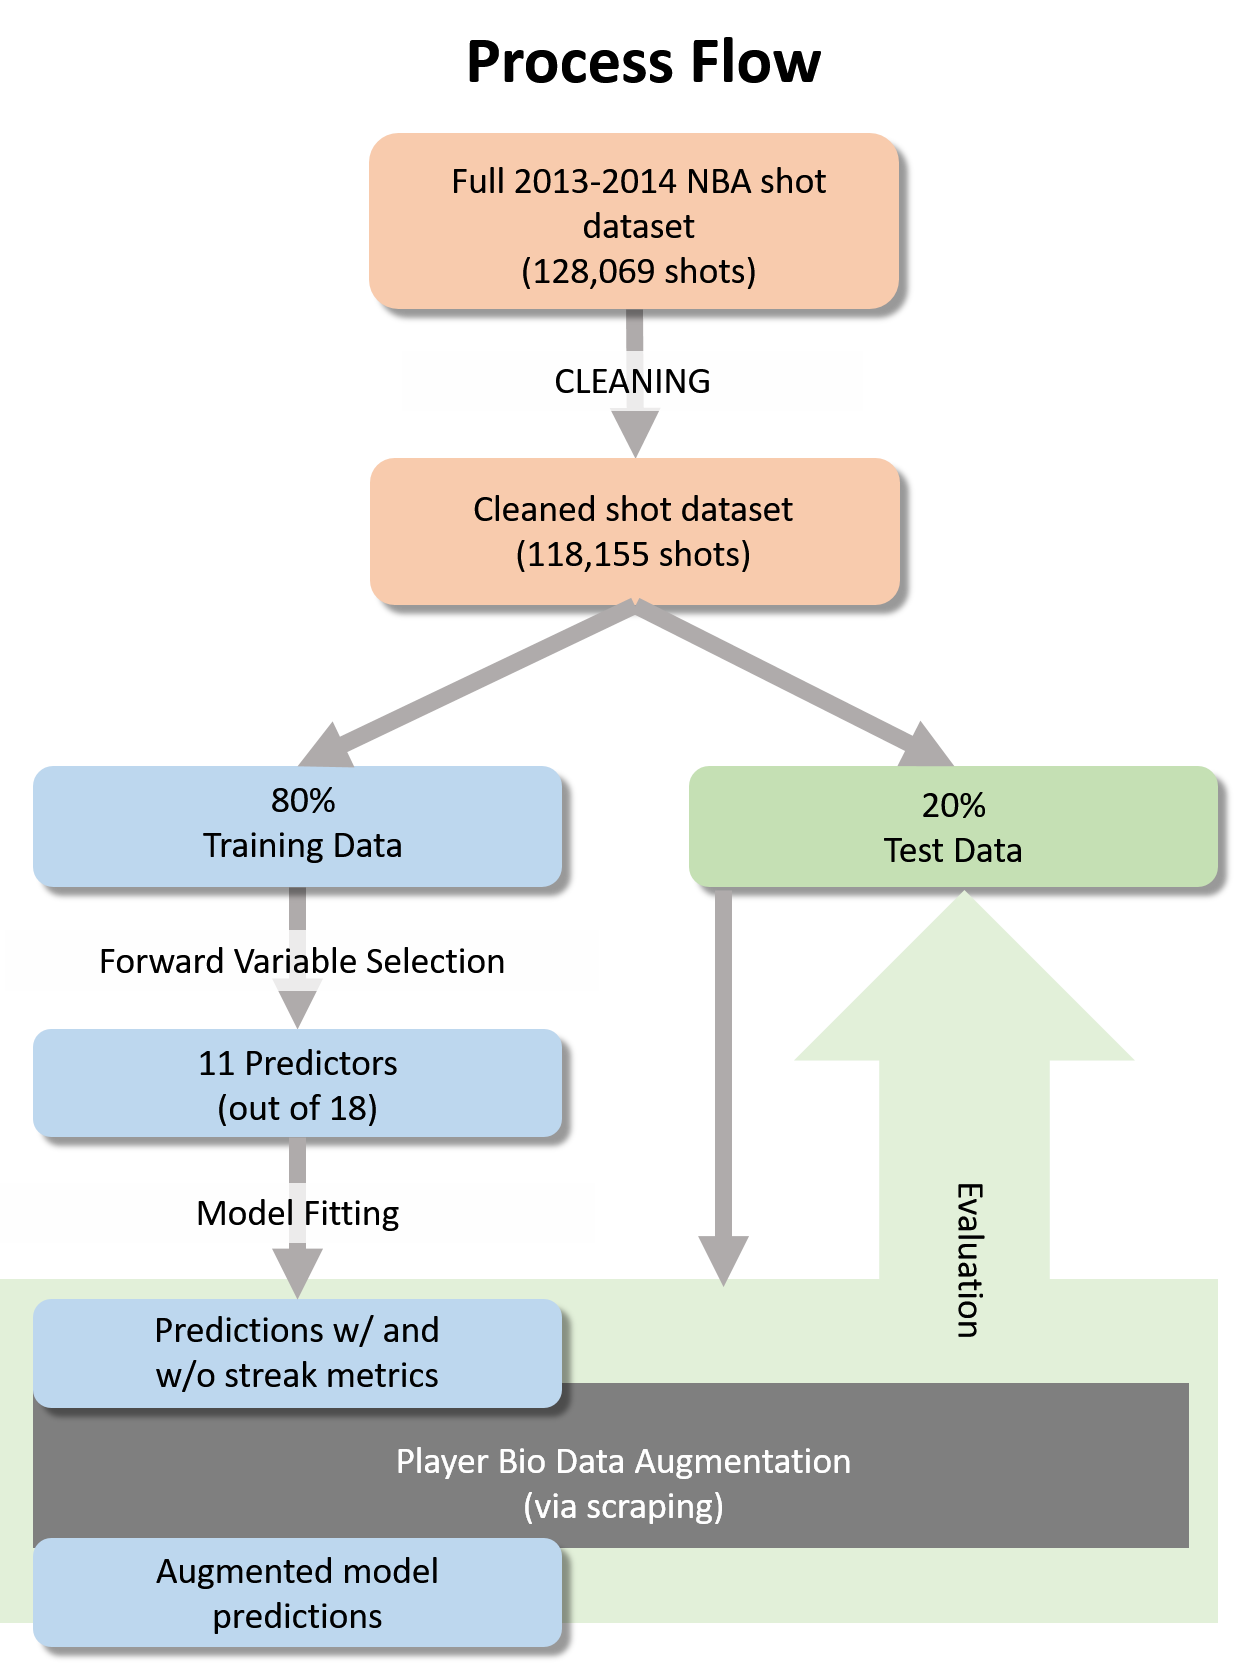
In our project, we are going to test if the hot hand theory is a true phenomena or just based on luck. Our work flow is showed bellow:
Data Exploration
Basic Data
To examine this theory, we used the data from Kaggle, including the 2013-2014 Season NBA stats.
The data includes a lot of detailed information about one shot, such as game index, matchup, match results, player name, technological stats about the shot (points, shot type, result, shot time, distance, etc.).
The original data is 128070 rows times 21 columns.
Extra Data
Though the original data set contains a lot of information about the shots, however, the information about the players themselves are not included. To get extra information such as height, weight, age and so on, we
scrapped data from the following website: http://www.basketball-reference.com/players/.
Exploratory Analysis
First, we would like to see how the shot accuracy and numbers of shots per player per game distributed across the data.
This is because we need to decide how much shots a player made per game can give reliable information.
For example, if a player only plays very few matches in that season, his stats are not reliable due to randomness.
Also, if the player made only one shot or two, we cannot determine the next goal based on previous shot or purely luck for lacking the empirical knowledge.
The following histograms showed the distribution of numbers of matches the players played and how many shots they made in each game.
The scatter plot shows the relationship of accuracy over numbers of attempts.
Since the minimum number of games is 27, those data are quite reliable.
By the scatter plot of accuracy over numbers of attempts, we get some intuitive understanding of the data.
We found that the high-attempts shooters have more stable accuracy than the low-attempts shooters. The shooters has small amounts are more likely to have extreme accuracy (0% or 100%).
This enlightens us to consider these two kinds of players differently. Based on the mean of shots per game, we divided players in two groups:
high-volume shooters (attempts to shoot more than mean per game) and low-volume shooters (attempts to shoot less than mean per game).
Data Wrangling and Feature Selection
The original data set has many details about each shot in each game. Some of them are useful while some of them are not.
Besides, some of the features need to be transformed into categorical or ordinal variables.
The following image shows how we deal with the features.
Based on the forward selection method, we have rank the variable by it's importance to our model. The results are showed in below:
Streak Metric
The data is recorded sequentially but independently.
So, we need to transform the shot results into a sequence instead of original format.
For example, if player A made 6 shots in game 1, the first 2 are missed, and the following 3 made goals and the last shot missed the target again, we will transform this into a string of 001110.
After this, we calculated the last “streak” of each shot. We tried 3 different measuremetns of streak.
Consecutive streak:
Using the same example, for the first shot, there is no previous knowledge, then we record this as (0,0), means 0 misses and 0 goals previously.
The second one will be (1,0), means 1 misses before and currently on miss “streak”. The third and fourth ones shall be (2,0) and (0,1) and go on.
Shot confidence streak:
Based on the data, we found that it has a very low probability of missing consecutive 4 or more shots (Pr=0.0448<0.05).
So we used whether the player missed all previous 4 shots or not as a streak metric.
This is will be set to 1 if the player made at least 1 shots of the 4 shots. Otherwise, it will be 0.
Instead of measuring how hot is the player, we consider this as measurement of "cold hand". We call this the "shot confidence" metric because
a player who has made at least 1 of the past 4 shots will be confident that they will be able to make another.
Previous shot percentage streak:
This is similar to previous one. Instead of binary value, we used the percentage to measure how many goals are made in previous 4 shots.
Modeling
Basic Streak Analysis
Given the results of forward selection, we obtain a baseline set of predictors, which do not include any streak metrics or biometric predictors.
Moving forward, we perform logistic regressions with these baseline predictors, attempting to classify shots as “made” or “missed”.
One by one, we add different streak metrics and biometric data to the list of predictors, and see how the results of our model change.
The basic streak analysis is simply to see whether the probability of making a shot increases given that the previous shot was successful.
This is flawed, since shot difficulty often sequentially increases as a player’s “streak” continues.
Therefore, we use multiple predictors, and see whether the coefficient of our streak metric, within the logistic regression model, is significantly different from zero.
We hypothesize that biometric data (differences in age, weight, and height) will account for other unseen difficulties in making a shot, and will in turn yield coefficients for our streak metric showing higher importance.
Below we summarize, for different combinations of streak metrics and biometric data, how the variable importances change within each model.
The above analysis shows that while biometric data does not have a large effect in any of our models, its presence does in some instances yield a significant effect of streak metrics.
We have summarized below the changes in overall model accuracy when predicting made and missed shots for the various combinations of predictors used in each model.
Additionally, we hypothesized that high volume shooters (those given the opportunity to shoot more) may be streakier than the general pool of shooters in the data.
We divided our data into two groups: high and low volume shooters. Using these two groups, we fit the same combinations of predictors and looked at overall model accuracy.
Streak & Biometrics Results
Model
Test Accuracy
Baseline
0.6150
Baseline and Biometrics
0.6129
Baseline, Bio Data, Best streak metric
0.6139
Low attempts, no streak metric
0.6198
High attempts, best streak metric
0.6098
Streak Analysis by Grouping on Shot Distance
Through variable selection we identified “Shot Distance” as the single most important variable affecting the success of a given shot (see Data Wrangling and Feature Selection part).
Of course, the further away a shot is from the hoop the more precision and skill it requires.
Among our data, we see a clear bias in how shots of different distances are selected.
Players tend to take a lot of shots close to the hoop due to ease, or shots at the 3-point line for higher return on the more difficult shot.
Those who watch the game of basketball know that taller players (usually centers and forwards) do not generally take shots far away from the hoop.
Our data confirms this: distributions of shot distances for short, medium height, and tall players show that taller players tend to take more shots close to the hoop.
The shortest players are the most likely to take shots at the 3-point line and beyond.
Intuitively one would assume that the closeness of a defender is directly related to the difficulty of a shot.
We predicted that the effect of closest defender distance would vary with the shot distance.
In particular, a defender that is one foot away from a shooter at the 3-point line would be considered above average,
or “tight defense,” whereas a defender one foot away from a player right at the hoop would by typical.
Our data shows that the average defender distance from the shooter varies as the shooter gets further from the hoop.
This effect is also seen to be important in whether the shooter is tending to make or miss the shot.
The following graph shows that mean defender distance is not correlated with makes vs misses when considering all shot distances.
However, when grouping the shots by increasingly higher shot distance thresholds, we see that the correlation between defender distance and the probability of missing a shot increases in magnitude.
NOTE: The negative correlation seen when considering all observations is due to noise.
Given the relationships between shot distance, shot accuracy, and player metrics, we decided to explore how the importance of different variables changes when grouping shots by shot distance.
Additionally, we included streak metrics in our analysis, since shots further away from the hoop require more skill.
Using the same predictors used in the general analysis of the streak metric and biometric data, we performed logistic regressions on normalized predictors for observations grouped by shot distance.
Conclusions
In conclusion, we see that the shot confidence metric has a coefficient that is consistently different from 0.
We decided to incorporate this metric into our final models.
In addition, we also choose to use a low volume shooter data set to build a model without streak and a high volume data set with the shot confidence metric.
We see that the prediction accuracy in our models do not improve significantly with different predictors.
When we incorporate our best hot hand metric, we see that it does not improve prediction accuracy of shots.
Under these models and definitions of hot handedness, hot hand theory is false.
For Basic Streak Analysis
Streak metrics do not have large effect on model prediction
The current models do not show significant differences in accuracy when the streak metrics are included in the predictor set.
This may be due to the fact that streaks tend to be rare, therefore only making up a small percentage of the total data set.
However, among the basic predictor set, the shot confidence metric was most influential.
Biometric data does not significantly affect model prediction
The biometric data, contrary to intuition, did not affect the overall prediction accuracy of the model when added to the baseline predictor set.
However, in the presence of the biometric data, the shot confidence metric and previous shot percentage metric were found to account for a small portion of the output.
Streaks play a significant role in predicting better players’ shots
Attempted shots is a good standard by which to measure how good a player is.
Better offensive players are given more opportunities to shoot. Models built on better players’ data
(those taking over 9 shots per game) showed significant increases in accuracy with the addition of streak metrics.
For Streak Analysis by Grouping on Shot Distance
Closest defender distance decreases in importance as shots get further away
This is interesting, since it is not an obvious relationship.
While one would expect the defender distance to be predictive of whether or not someone makes a shot, the fact that it is more important close to the hoop is not as obvious.
This may, however, be an artifact of our dataset.
The dataset only shows the closest defender's distance, not necessarily the person who is actively contesting the shooter's shot.
Perhaps there is better correlation between the closest-defender-distance
and the shot probability close to the hoop because the closest defender listed is likely to be the actual defender when the shooter is near the hoop.
Longer touch time affects accuracy adversely when close to the hoop but positively when further away
From the above analysis, we see that touch time (the time the ball is held by the shooter before shooting) is negatively correlated when the shot is close to the hoop,
but becomes positively correlated for shots in the 3-point range.
Height difference mainly affects shots between 5 and 10 feet from the hoop
Height difference doesn't seem to have much of an effect on the shot probability.
However, it seems that it may have a significant effect for shots in the range of 5-10 feet.
Perhaps mismatch defense is most effective for stopping midrange shots.
Weight difference helps midrange shooters but hurts shots both close and very far from the hoop
In both analyses looking at the shot-range dependence, weight the importance of weight difference peaks for jump shots in the 15-20ft range.
When the defender weighs more than the shooter, it seems the shooter has an advantage in mid-range jumpers.
It is interesting to conjecture why, but intuition says that, given the general quickness of mid-range jumpers, the heavier defenders probably have a hard time dealing with quickness of the shot.
Further, the weight difference works against shooters when the shot is close to the hoop.
This makes sense, as larger defenders who are better at defending near the hoop tend to be heavier.
Streak metrics did not play a significant role in shot success despite grouping by shot distance
Once again, it seems that the streak metric does not show a significant correlation with made/missed shots.
Future Work
There are still some other factors can influence our results. The following are examples:
Game-by-game effects
It is likely that team matchups have a significant effect on streaks: a good team against a bad team will be most likely score more easily.
Optimal binning of shot clock/game clock
It is possible that the range of the time data confounds our model. Binary encoding may help.
We could explore these in the future.
Acknowledgements
[1] T. Gilovich, R. Vallone, A. Tversky, “The Hot Hand in Basketball: On the Misperception of Random Sequences”, Cognitive Psychology 17 (1985) 295-314
[2] A. Bocskocsky, J. Ezekowitz, C. Stein, “The Hot Hand: A New Approach to an Old “Fallacy””, MIT Sloan Sports Analytics Conference , 2014
Special thanks to www.basketball-reference.com for the player bio data, and J. Song for guidance as our TF